
Integración de Microsoft Sentinel
Guía de integración: Conectando Microsoft Sentinel con HiperAI Esta guía describe los pasos necesarios para configurar Microsoft Sentinel para recibir registros de seguridad de SecureAI a través de las reglas de recopilación de datos de Azure (DCR).Paso 1: Crear la identidad de la aplicación (registro de la aplicación)
Primero, crearemos una identidad para su aplicación en Azure, lo que le permitirá autenticarse de forma segura.A. Vaya a Azure Active Directory
En Azure Portal, busque y seleccione Azure Active Directory.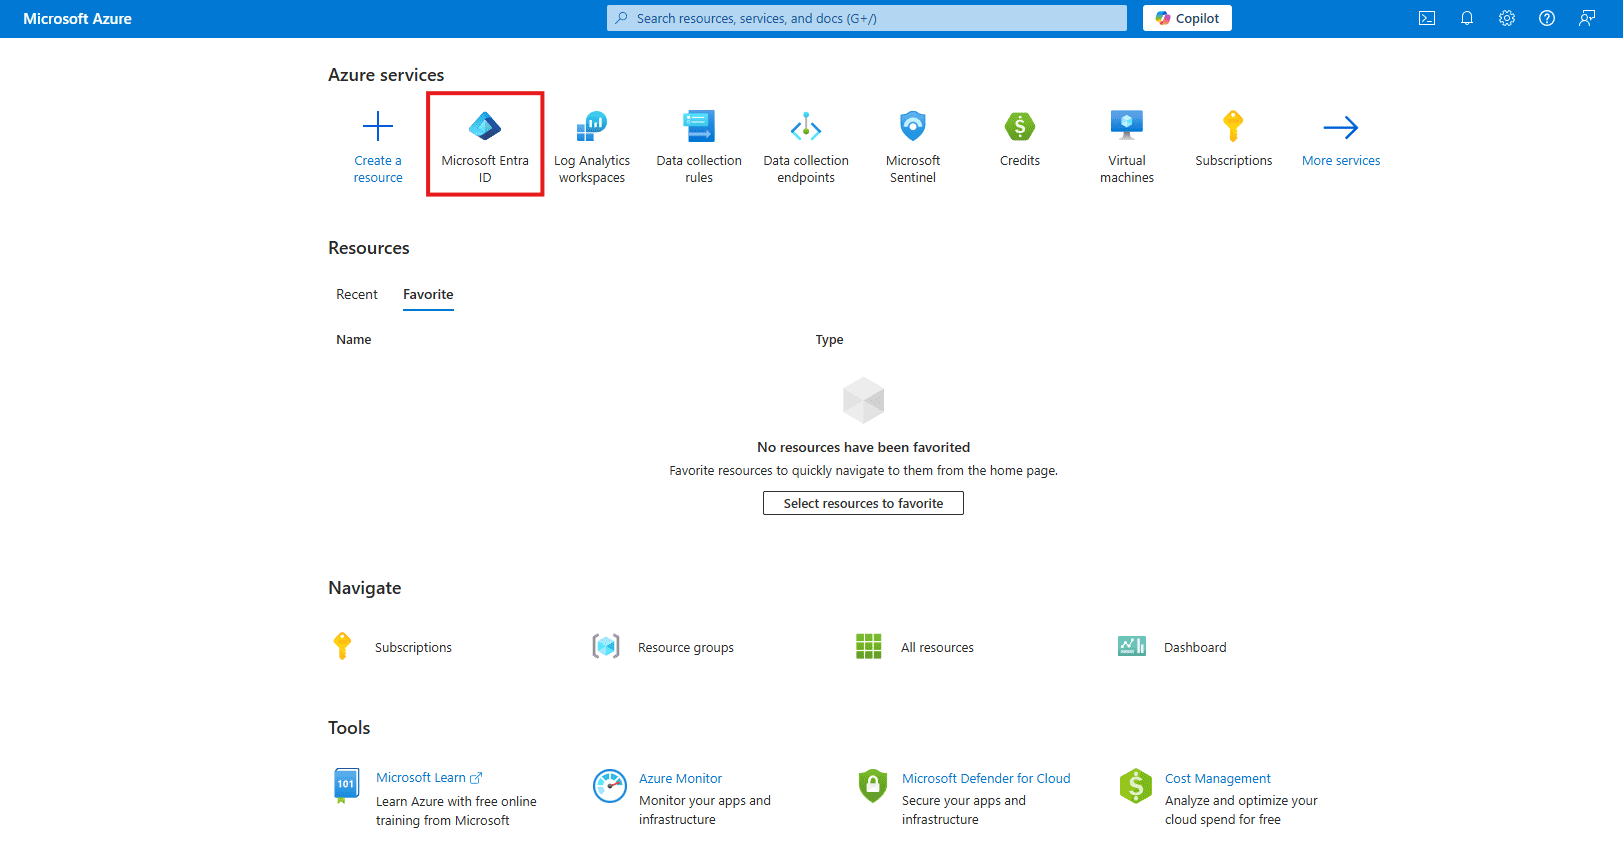
B. Nuevo registro
En el menú de la izquierda, navegue hasta Registros de aplicaciones y haga clic en + Nuevo registro.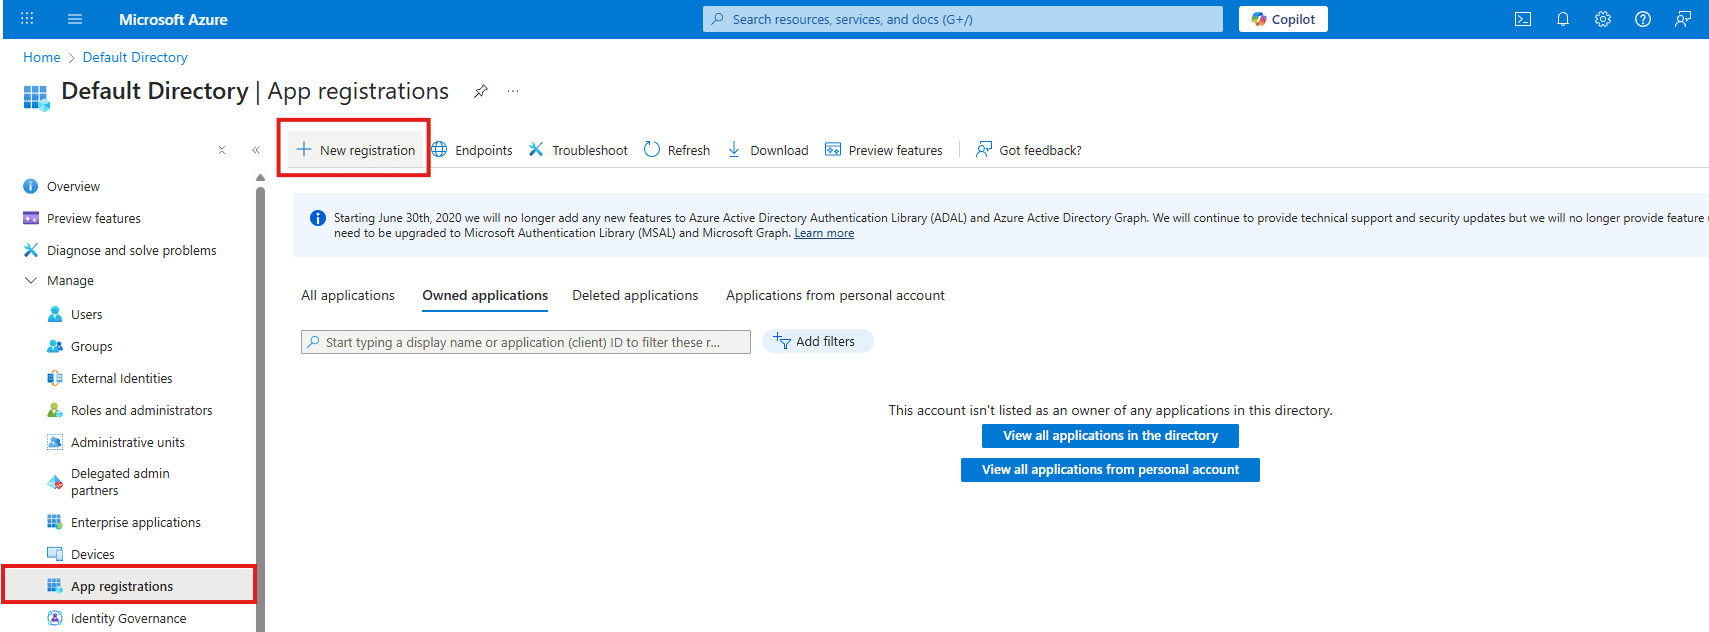
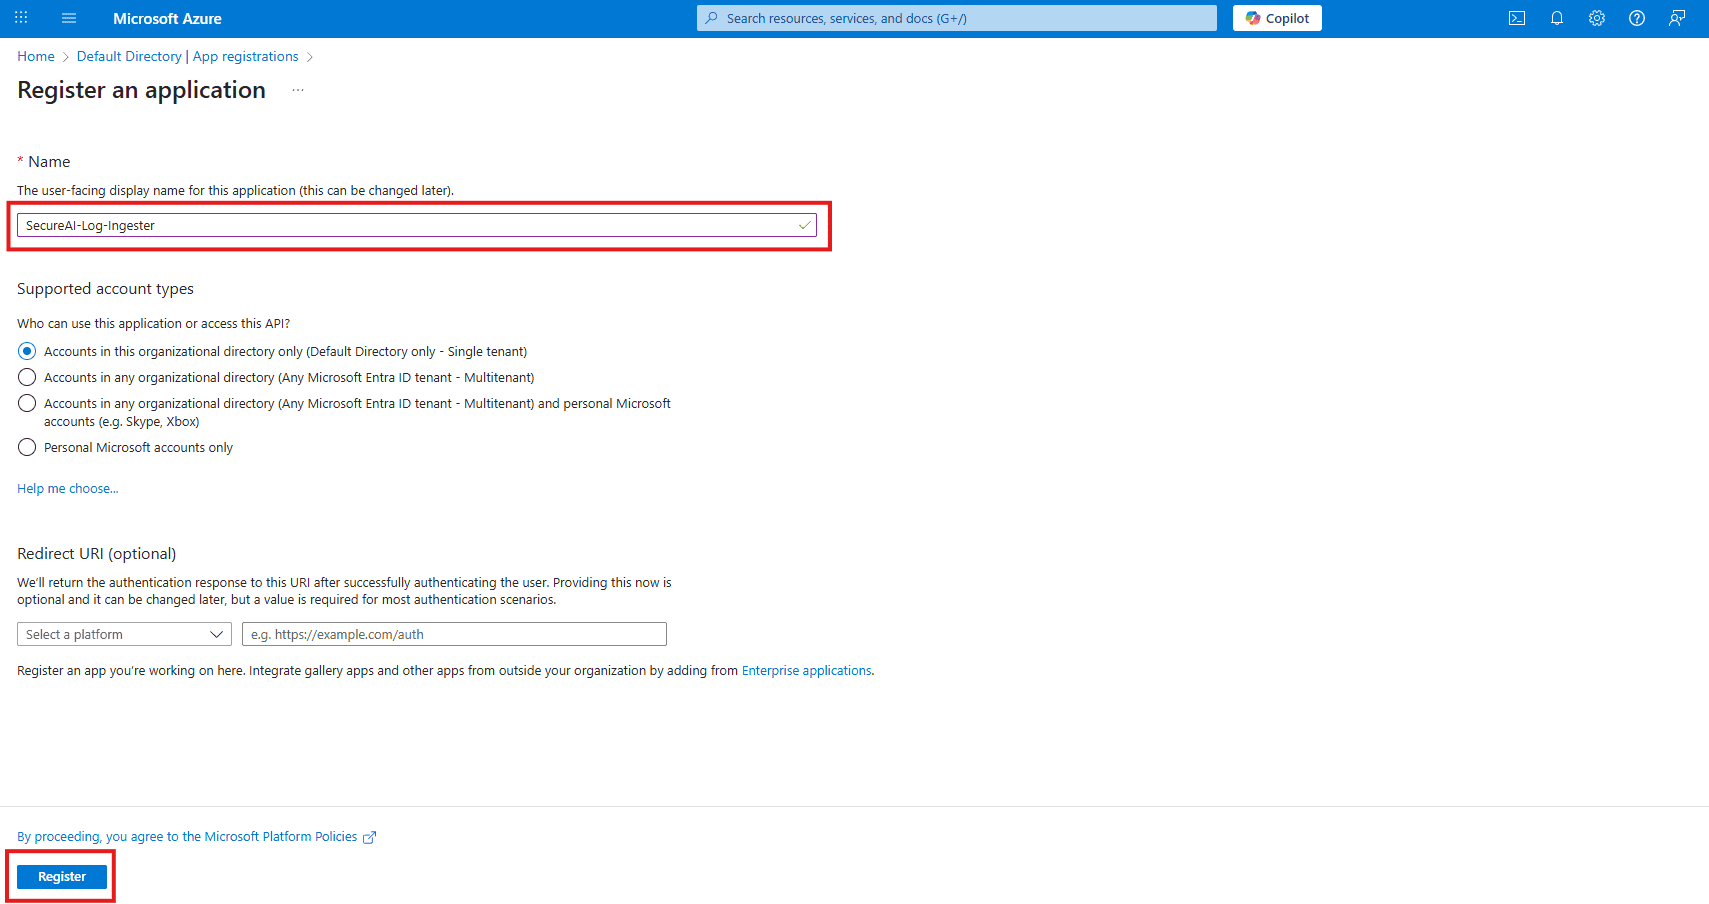
C. Nombre la aplicación
Proporcione un nombre claro, comoSecureAI-Log-Ingester y deje las otras opciones con sus valores predeterminados. Haga clic en Registrarse.
D. Copie las identificaciones
Desde la página Descripción general de la nueva aplicación, copie y almacene de forma segura los siguientes valores:- ID de aplicación (cliente)
- ID del directorio (inquilino)
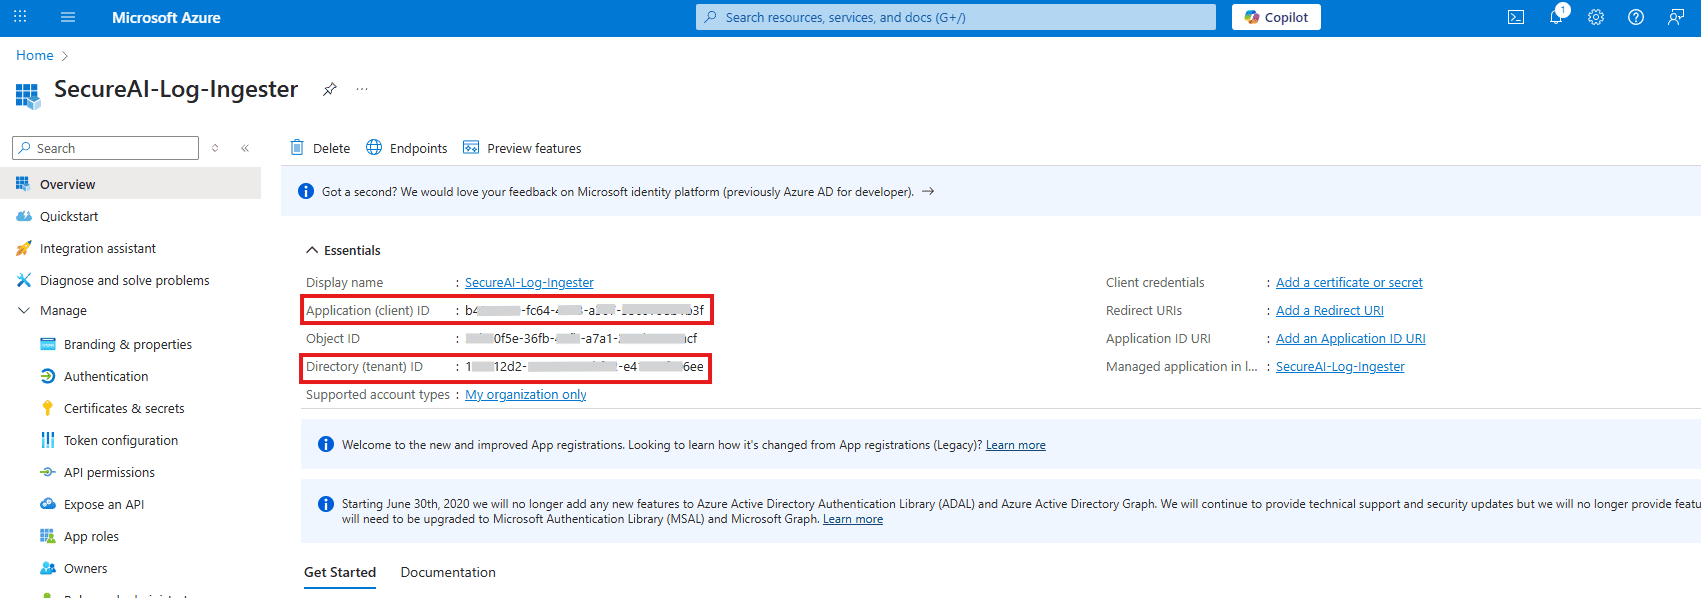
E. Crear el secreto del cliente
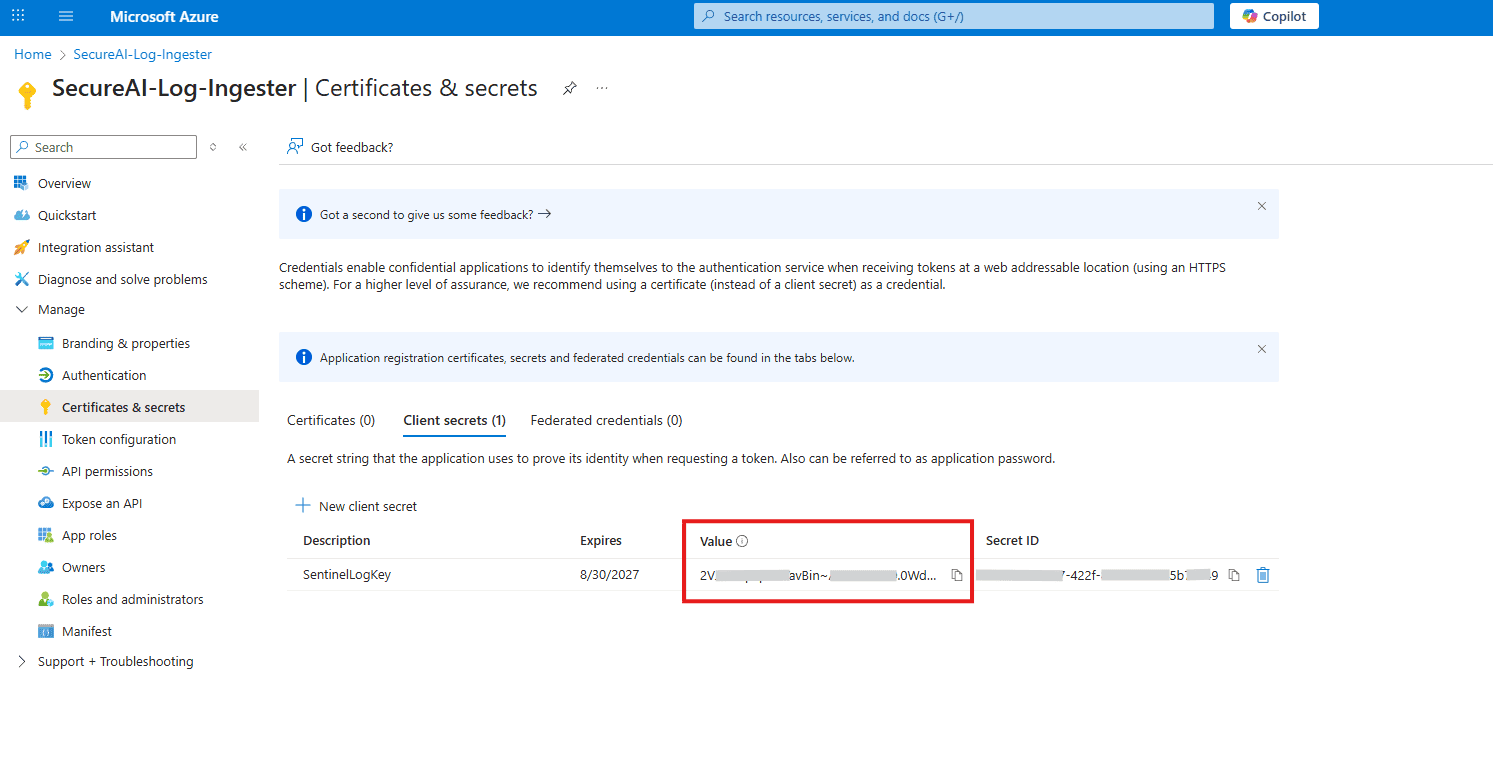
En el menú de la izquierda, vaya a Certificados y secretos y haga clic en + Nuevo secreto de cliente. Proporcione una descripción (por ejemplo, “SentinelLogKey”) y haga clic en Agregar.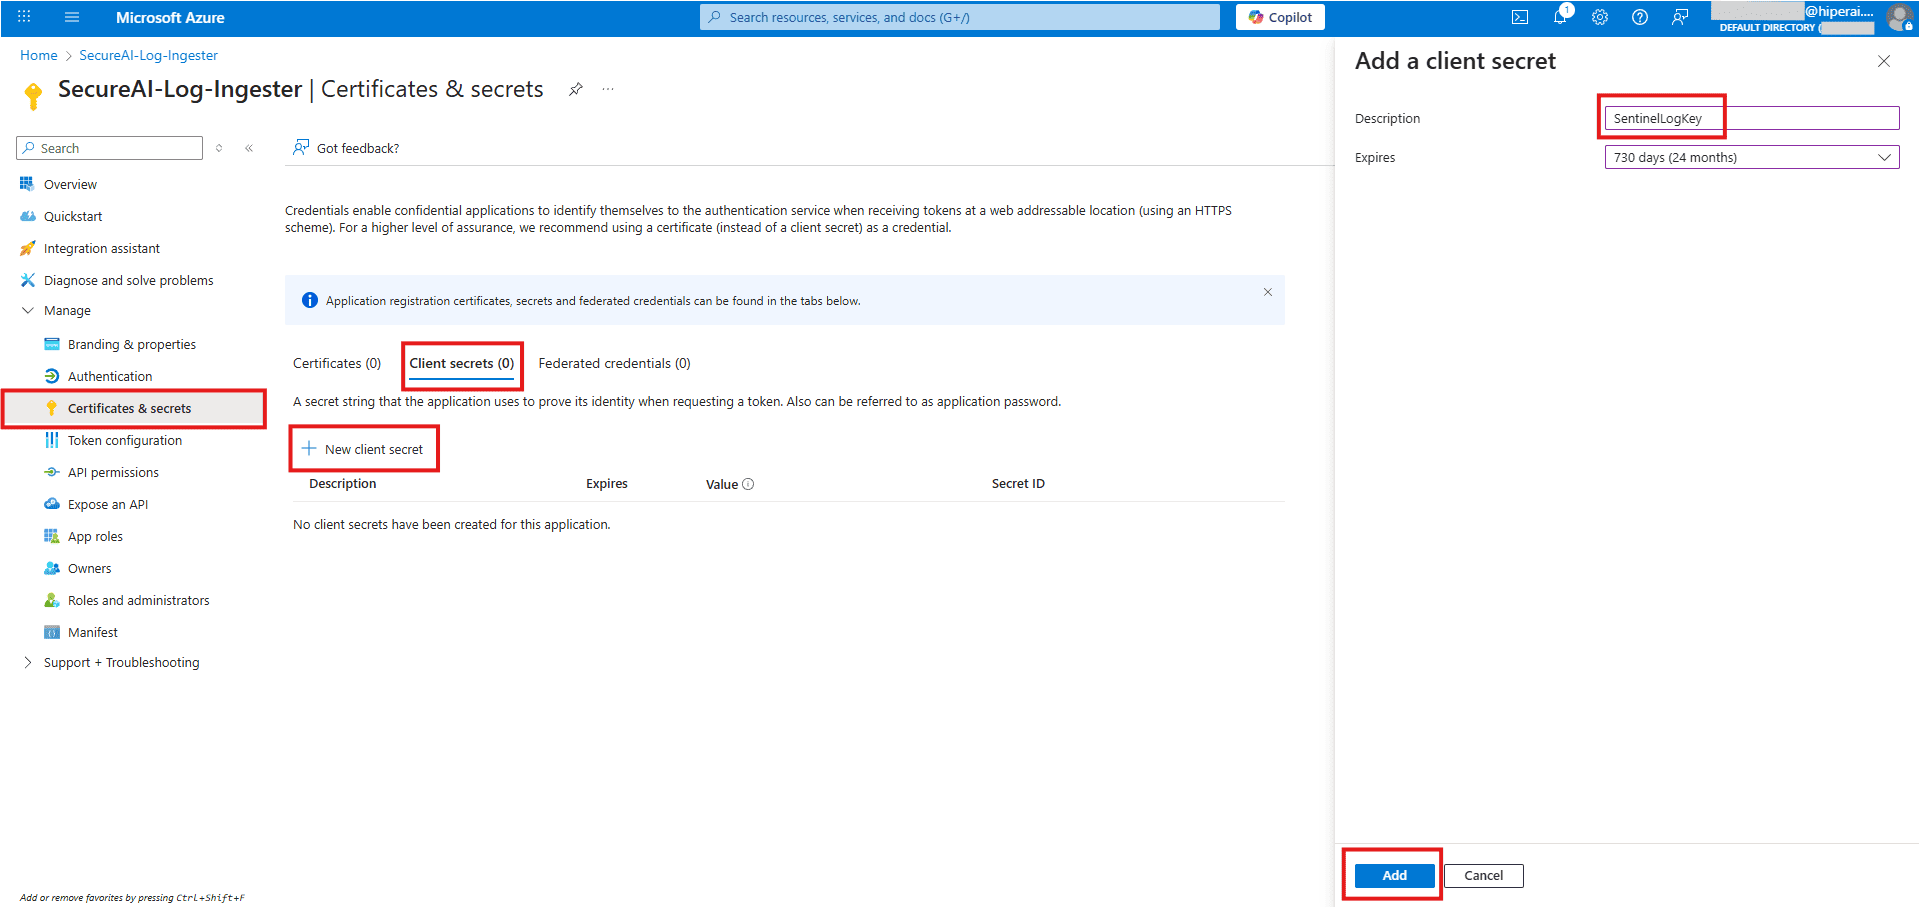
Paso 2: Crear la infraestructura de ingesta de Azure
Ahora, construiremos la “vía” y el “almacenamiento” para sus registros.A. Crear el endpoint de recopilación de datos (DCE)
1. Encuentre el servicio
En la barra de búsqueda de Azure, busque y seleccione Endpoints de recopilación de datos.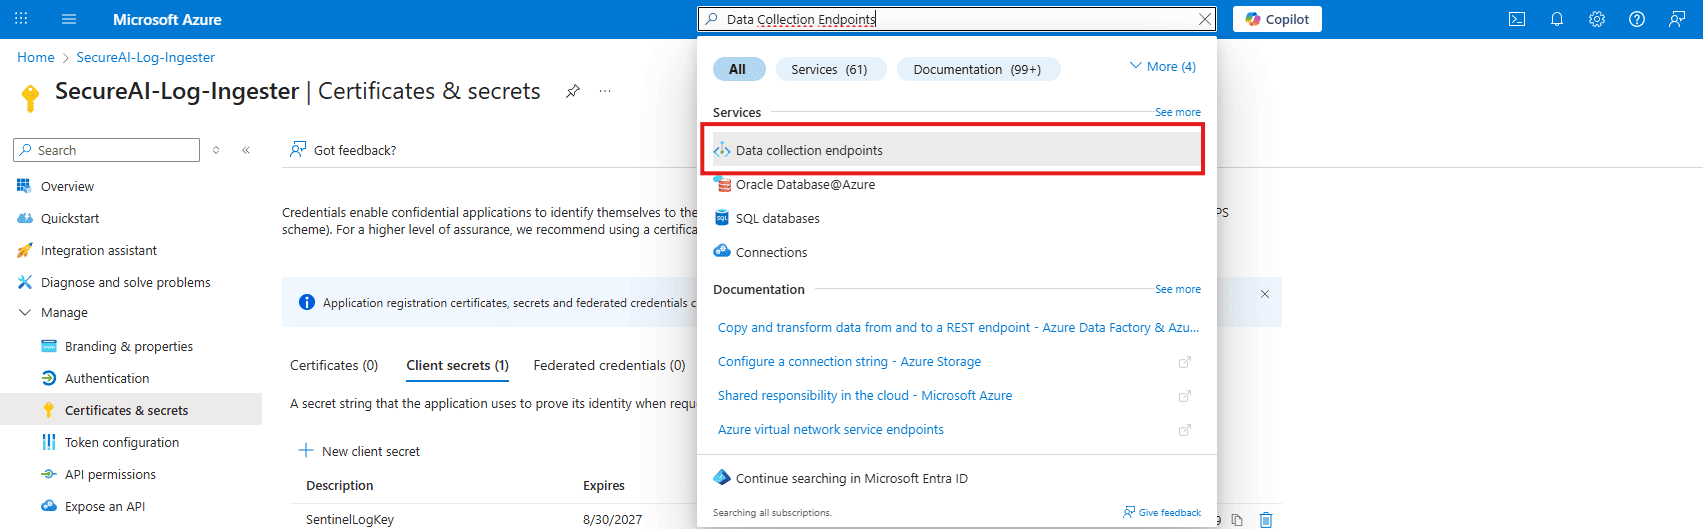
2. Crear un nuevo DCE
Haga clic en + Crear.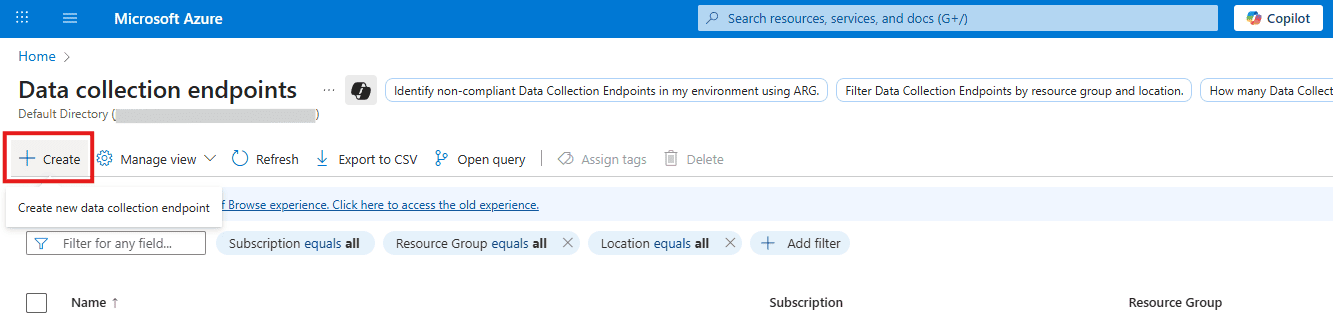
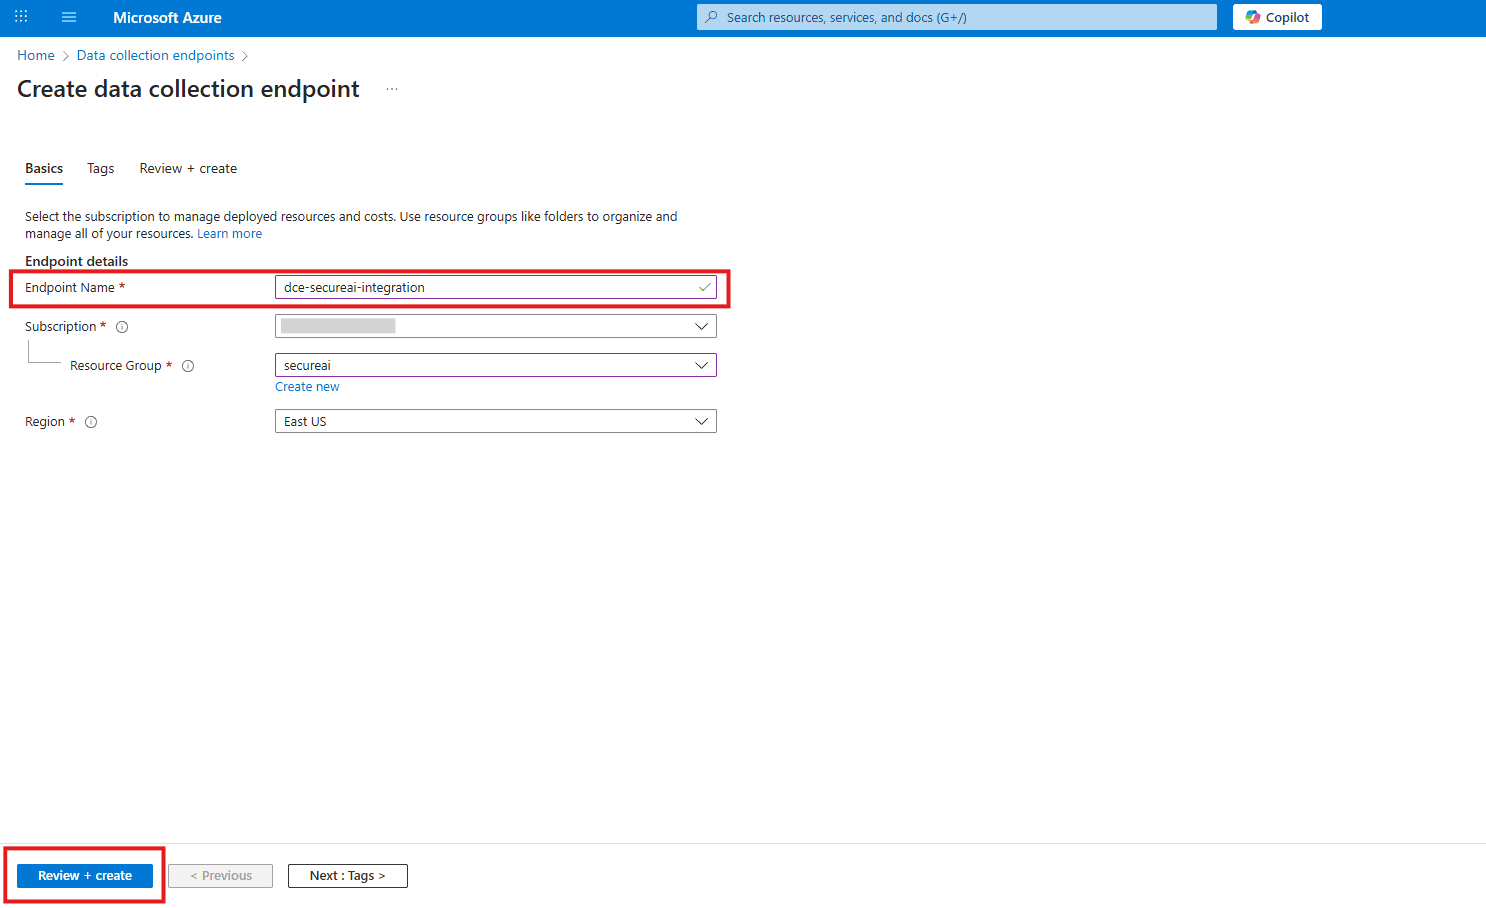
3. Configurar el DCE
- Nombre:
dce-secureai-integration - Región: elija la misma región que su espacio de trabajo de Log Analytics
- Haga clic en Revisar + crear y luego en Crear.
4. Copie el URI
Una vez implementado, navegue hasta el recurso. En su página Descripción general, copie el URI de ingesta de registros y guárdelo.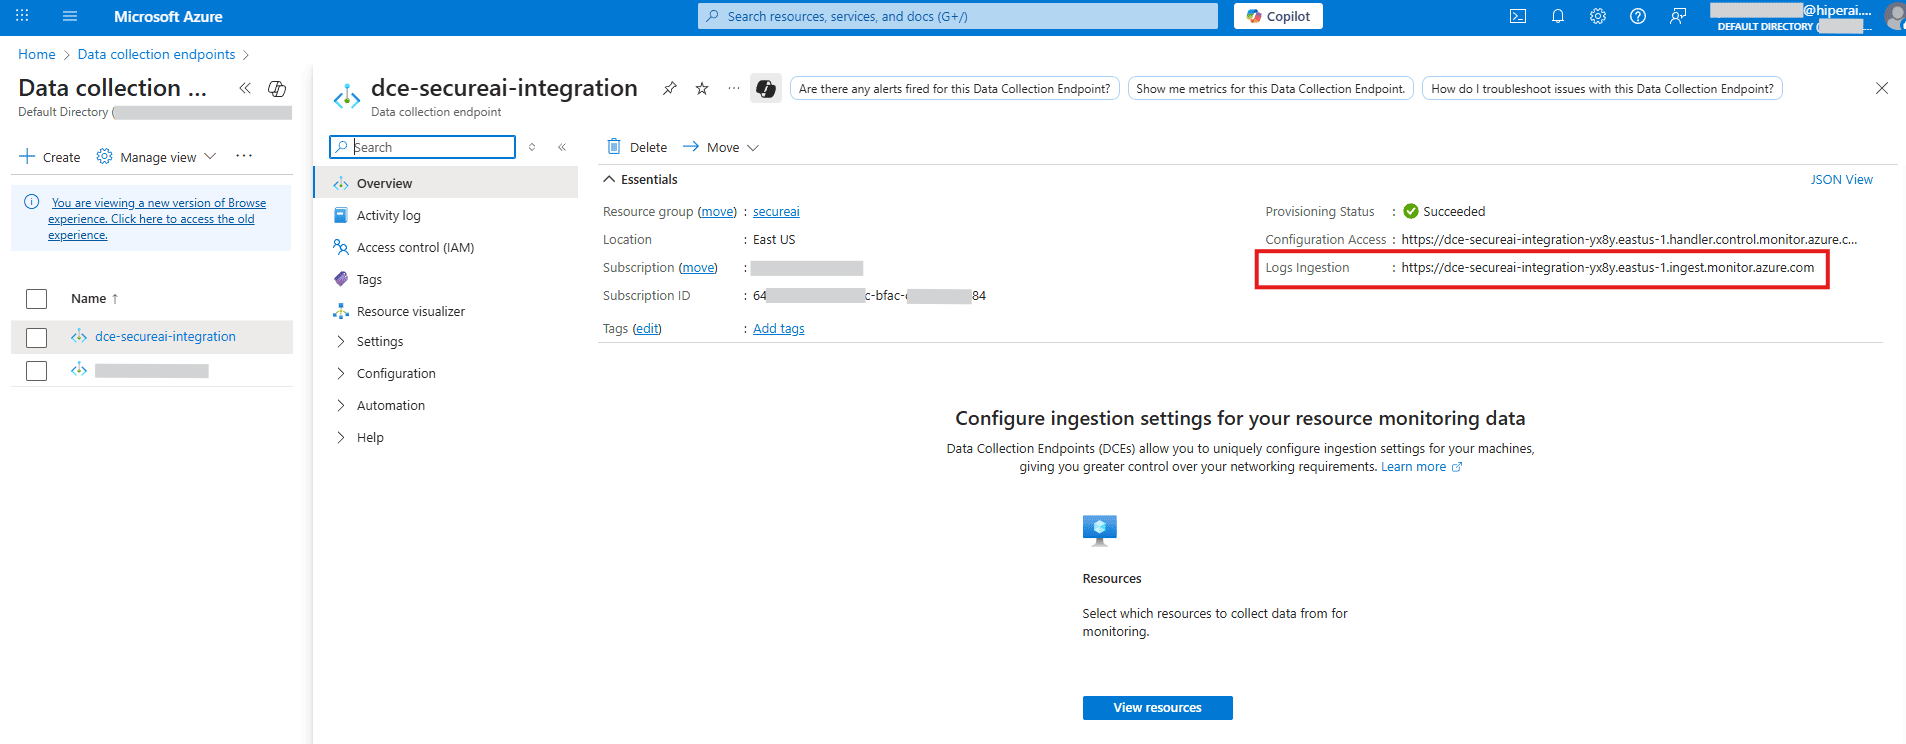
B. Crear la tabla personalizada y la regla de recopilación de datos (DCR)
1. Vaya a Log Analytics
Navegue hasta su Espacio de trabajo de Log Analytics.2. Crear una tabla personalizada
En el menú de la izquierda, haga clic en Tablas, luego + Crear y seleccione Nuevo registro personalizado (basado en DCR).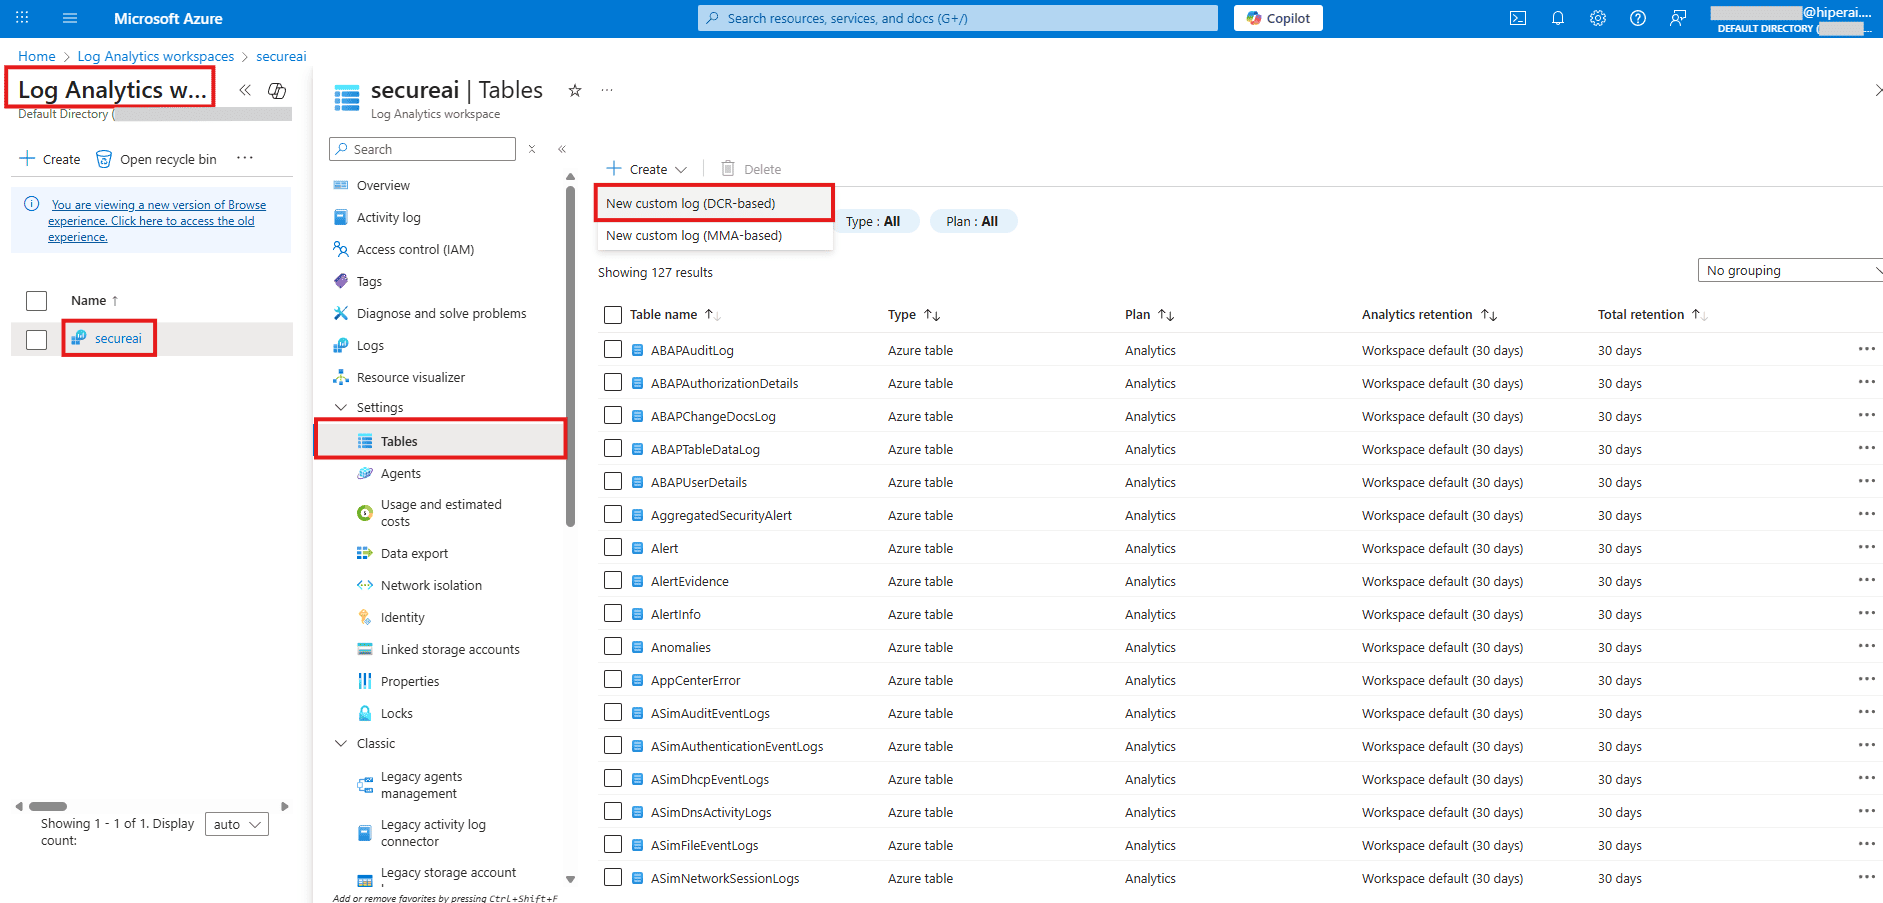
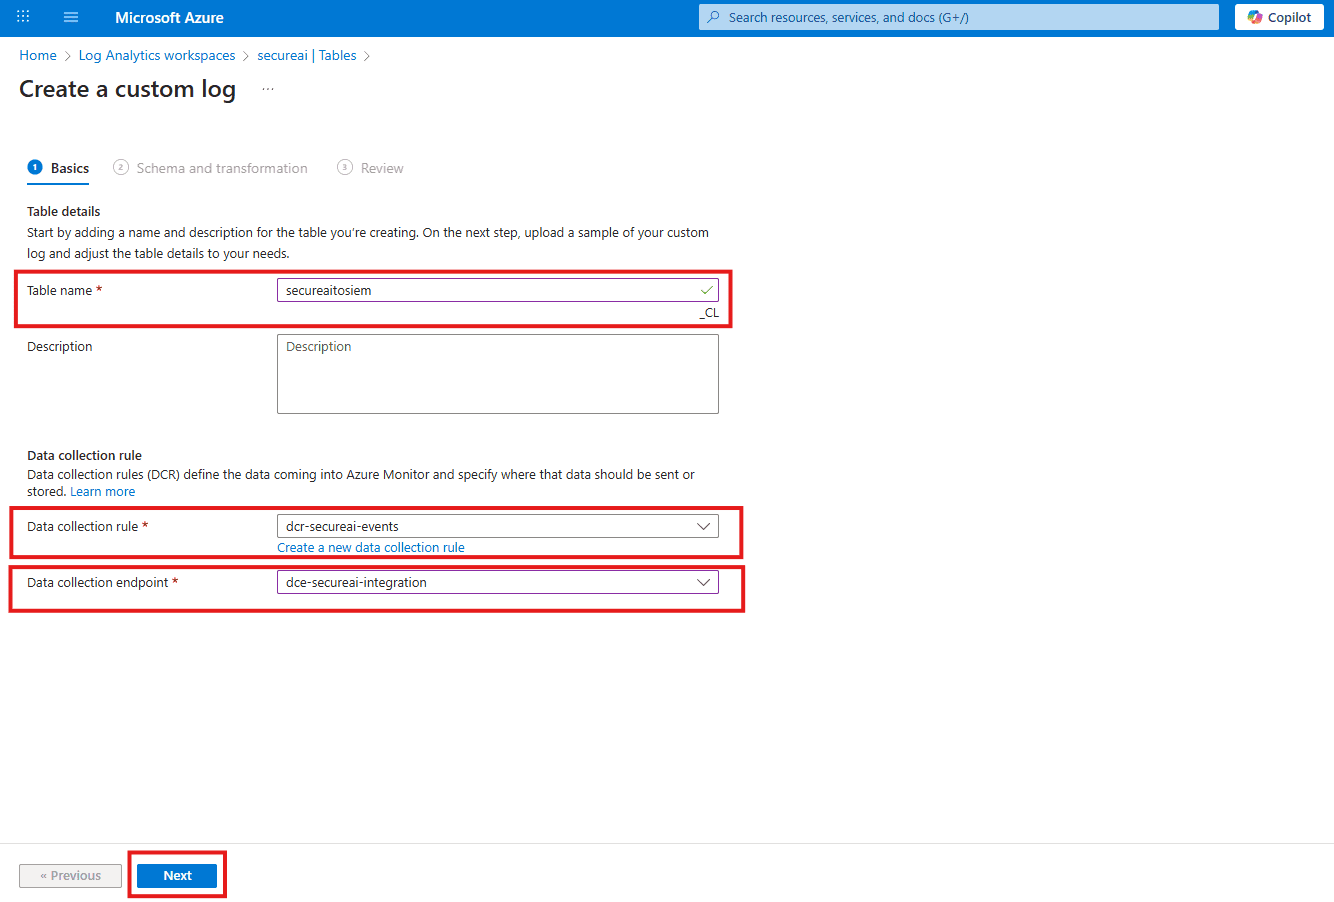
3. Pestaña “Conceptos básicos”
- Nombre de la tabla:
secureaitosiem(Azure agregará automáticamente_CL, creando el nombre completosecureaitosiem_CL) - Regla de recopilación de datos: seleccione “Crear un nuevo…” y asígnele el nombre
dcr-secureai-events
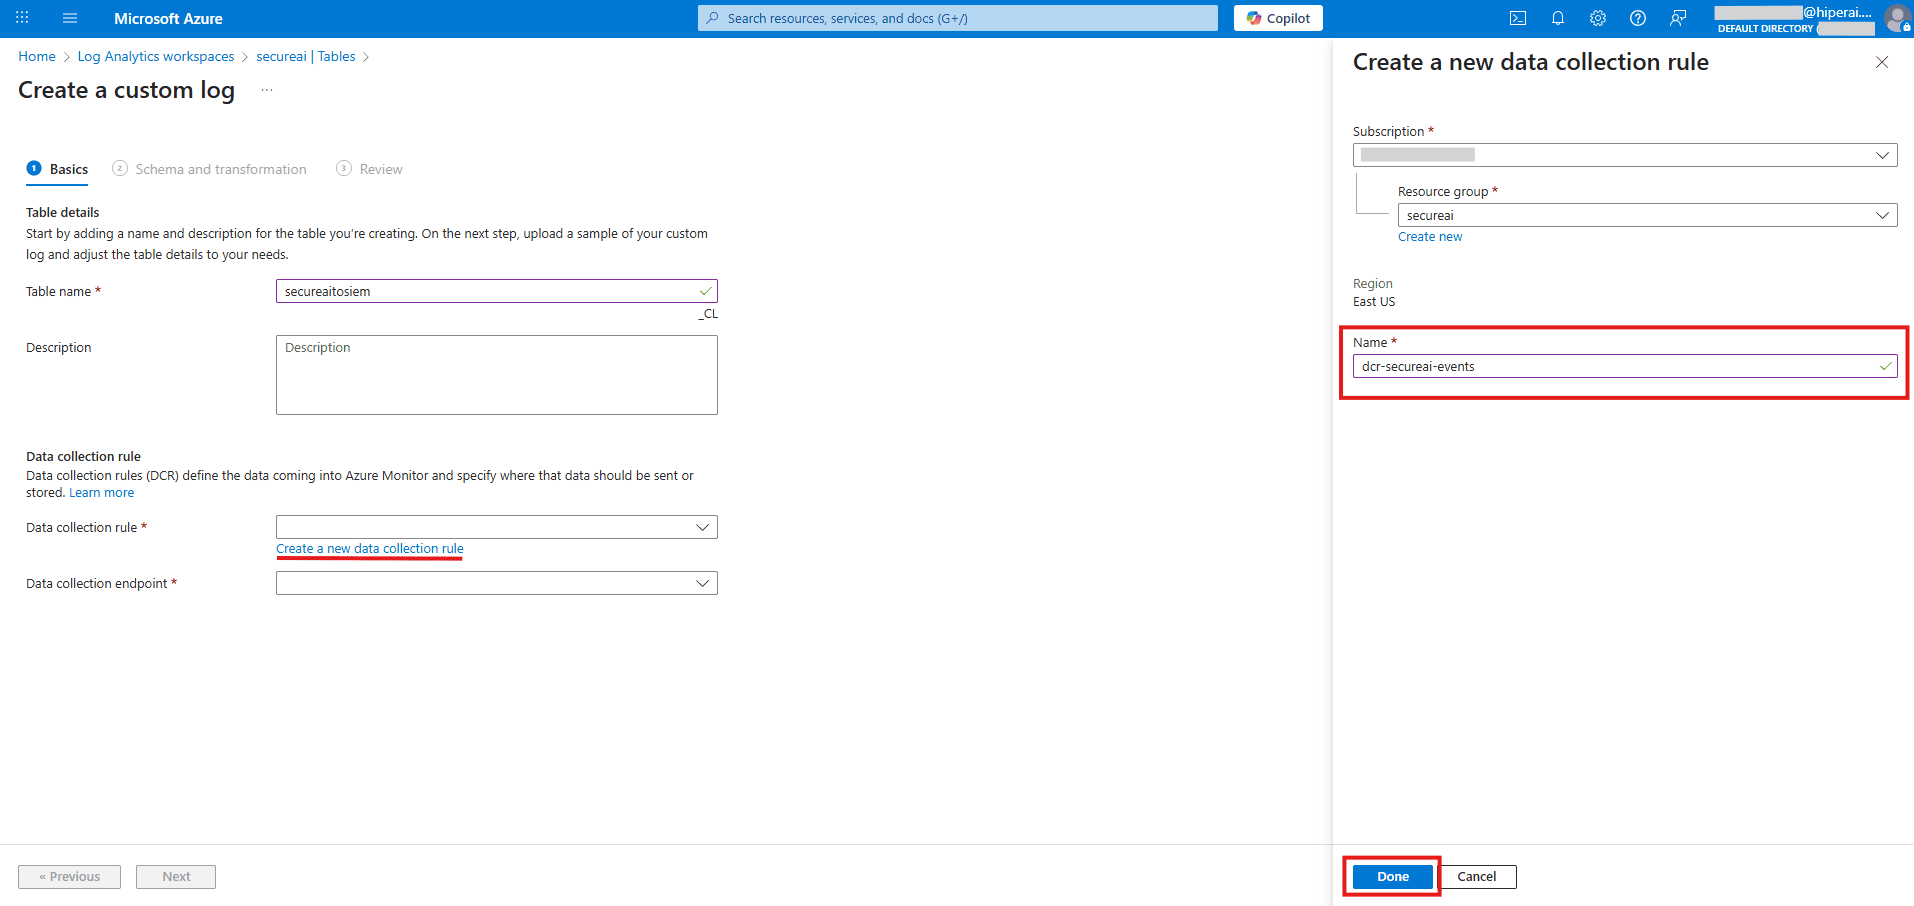
- Endpoint de recopilación de datos: seleccione el DCE que creó anteriormente (
dce-secureai-integration) - Haga clic en Siguiente: Esquema y transformación
4. Pestaña “Esquema y transformación”
Sube un archivo de muestra: El sistema te lo indicará. Cree un archivo.json con el siguiente contenido y cárguelo:
5. Aplicar la transformación
El sistema puede mostrar una advertencia sobre el campo TimeGenerated. Haga clic en el botón Editor de transformación, elimine todo el contenido existente y pegue la siguiente consulta KQL completa: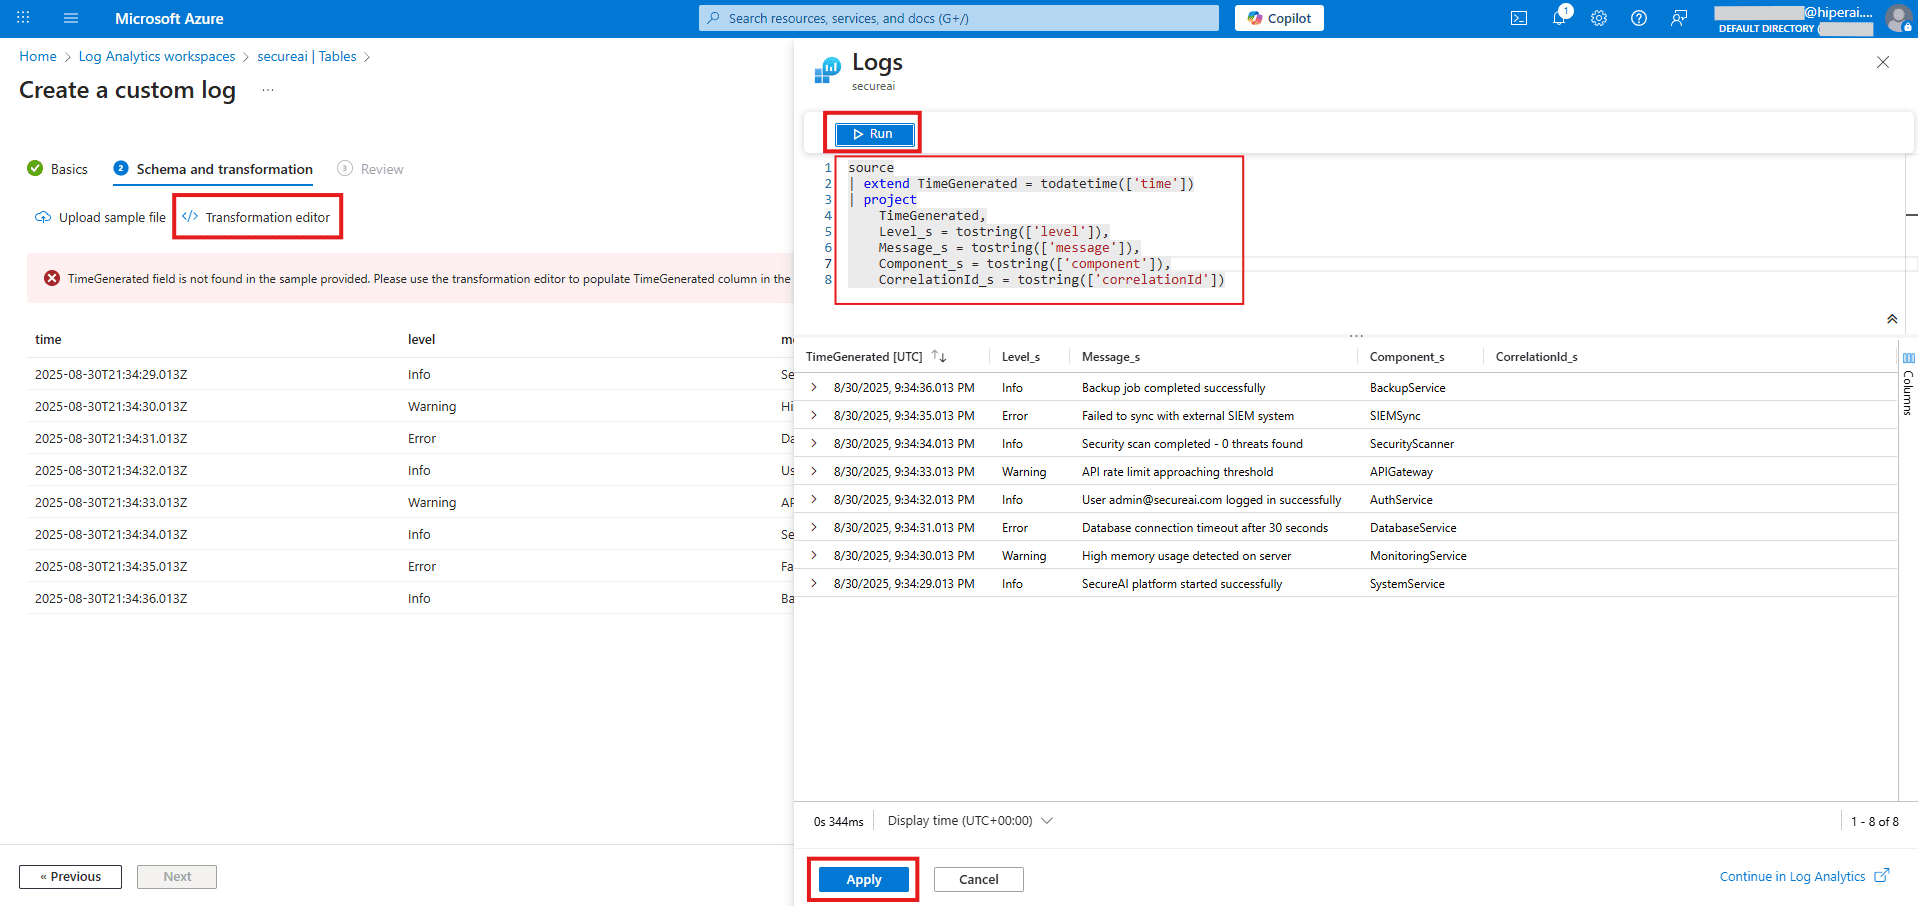
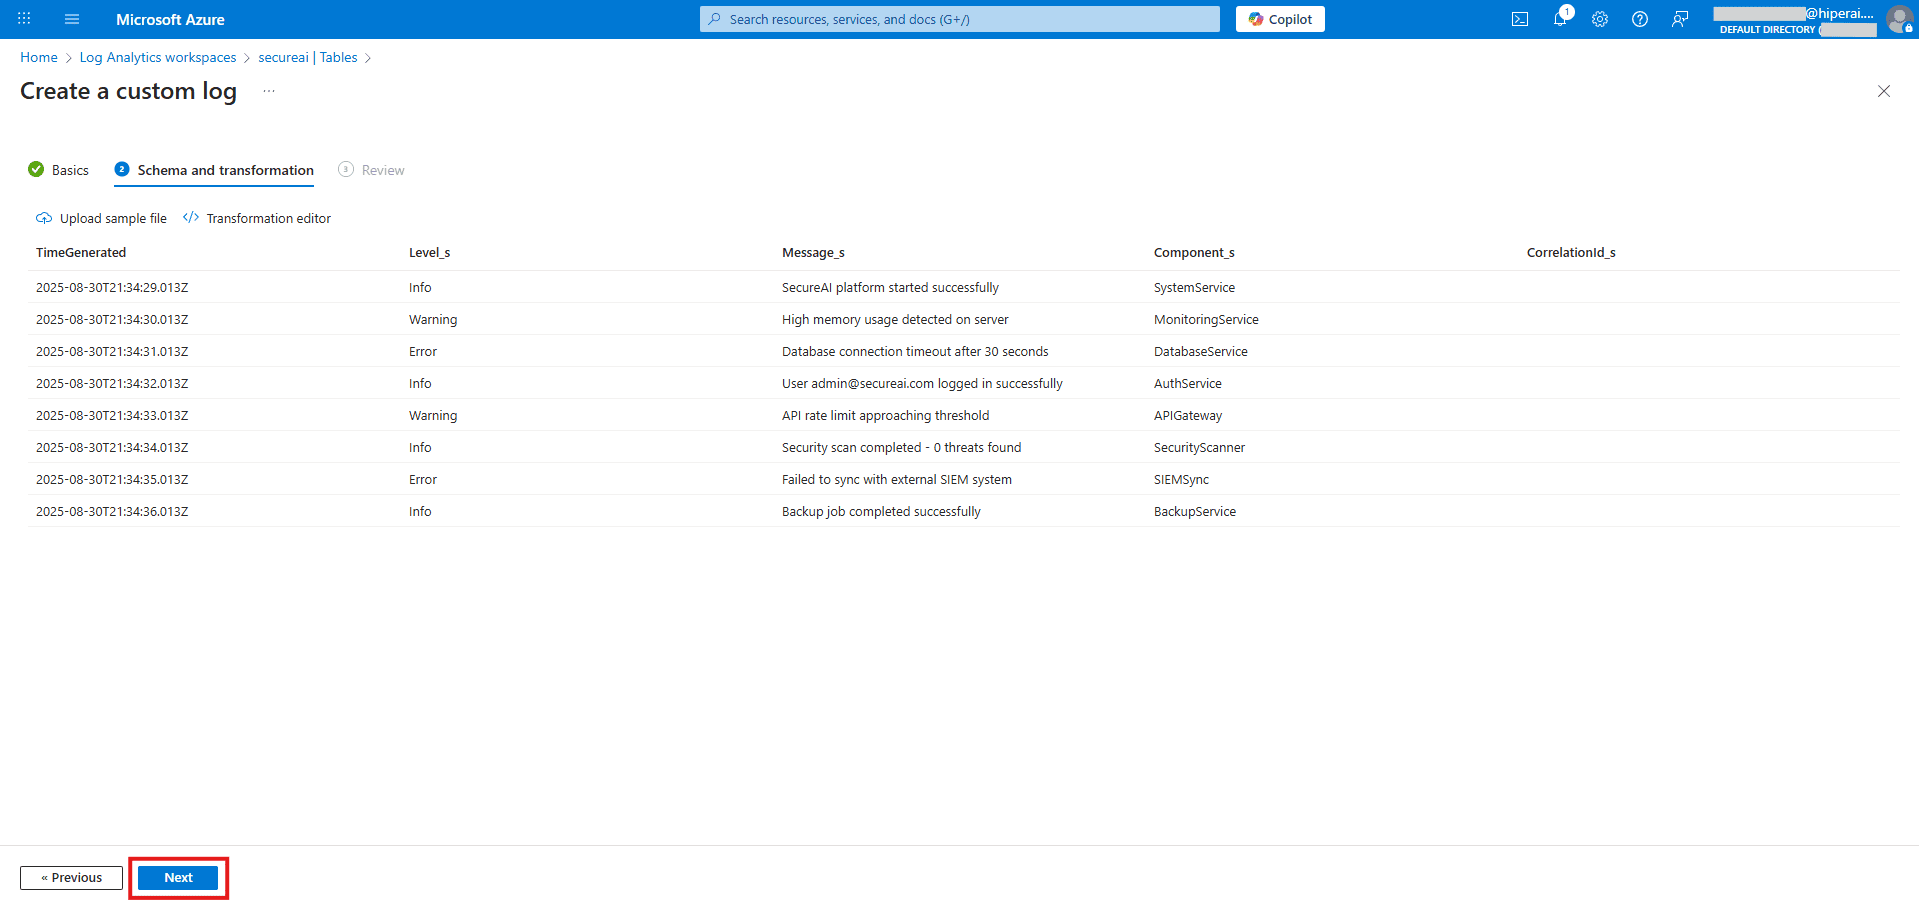
6. Finalizar la creación
Haga clic en Siguiente: Revisar + crear y luego en Crear.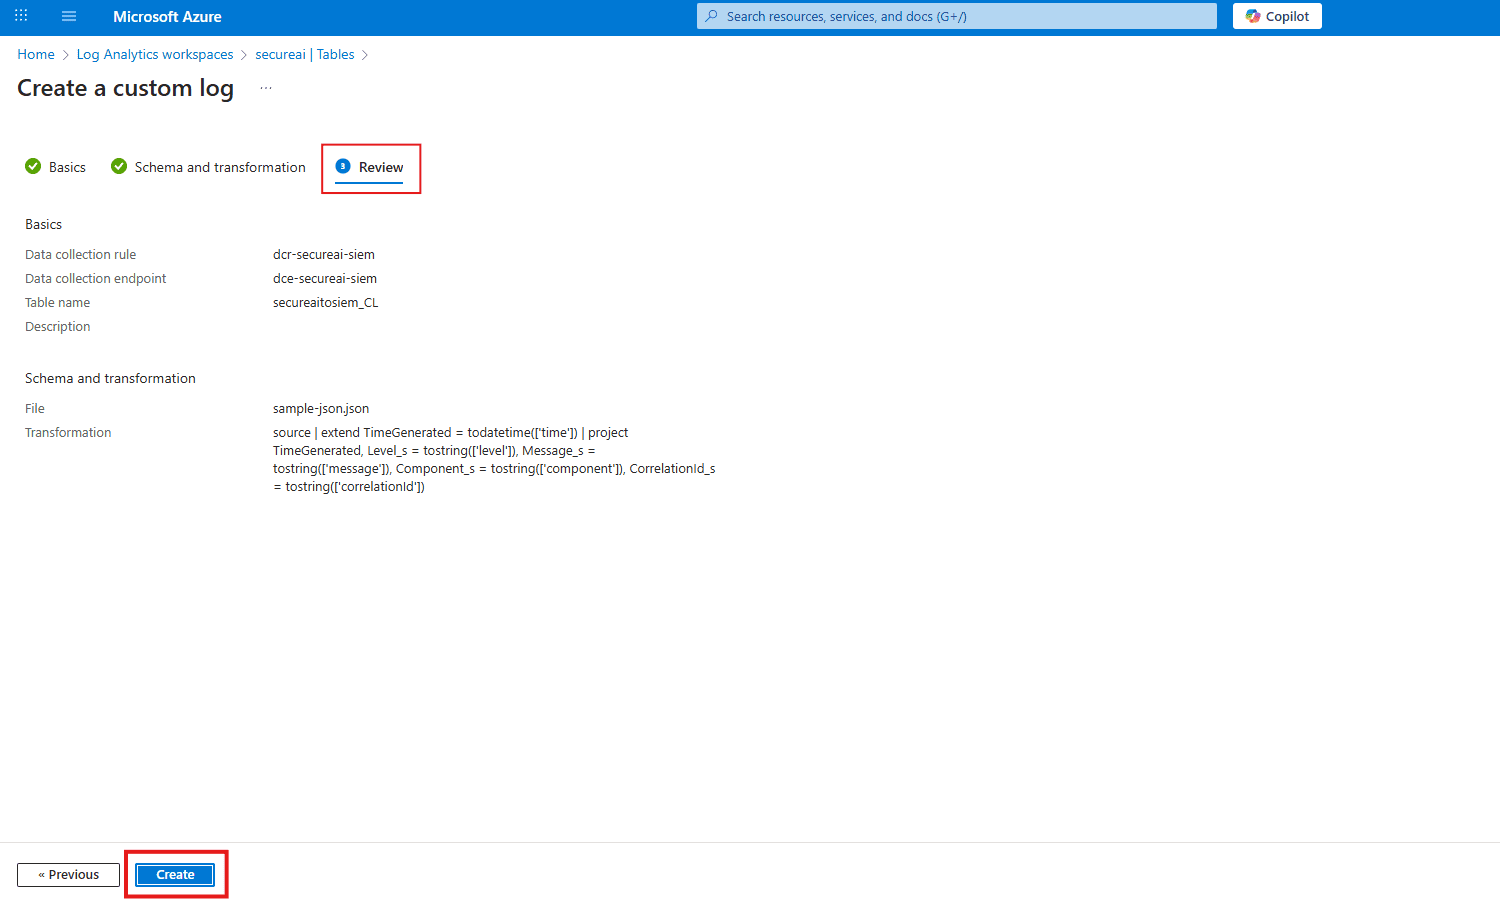
Paso 3: Conectar la identidad a la infraestructura (permisos)
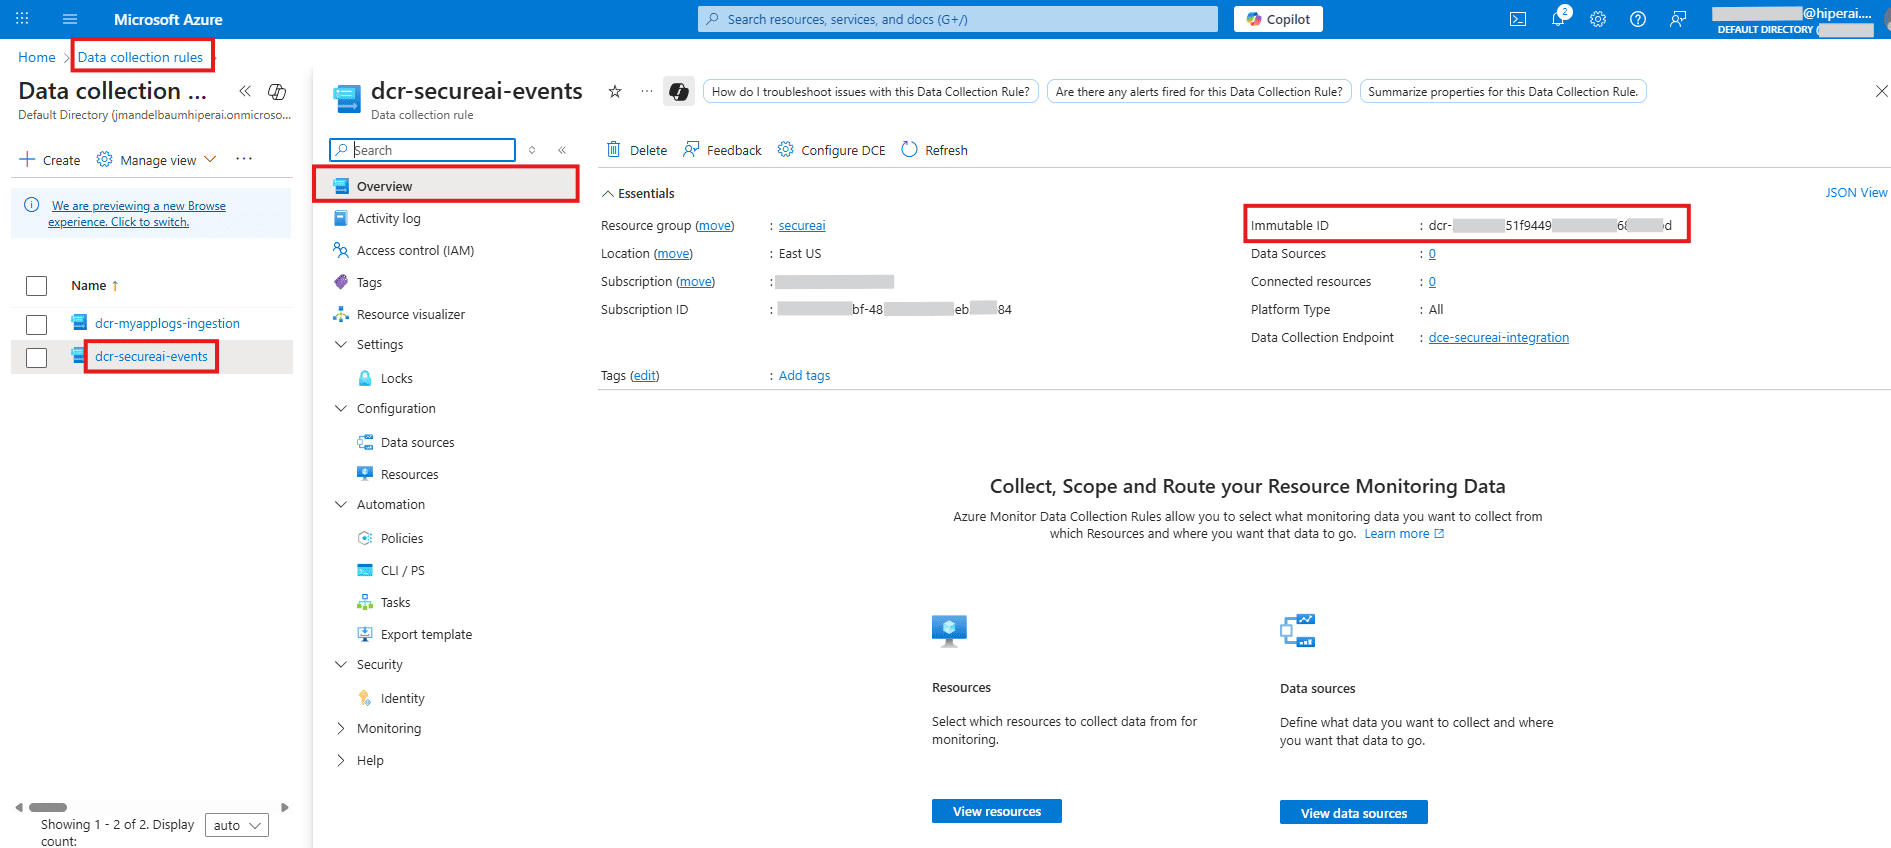
Este paso crucial otorga permiso a nuestra aplicación para utilizar la regla de recopilación de datos que acabamos de crear.A. Vaya a su nuevo DCR
Busque y abra su regla de recopilación de datos,dcr-secureai-events y en “Descripción general”, copie el ID inmutable y guárdelo para su integración.
B. Asignar el rol
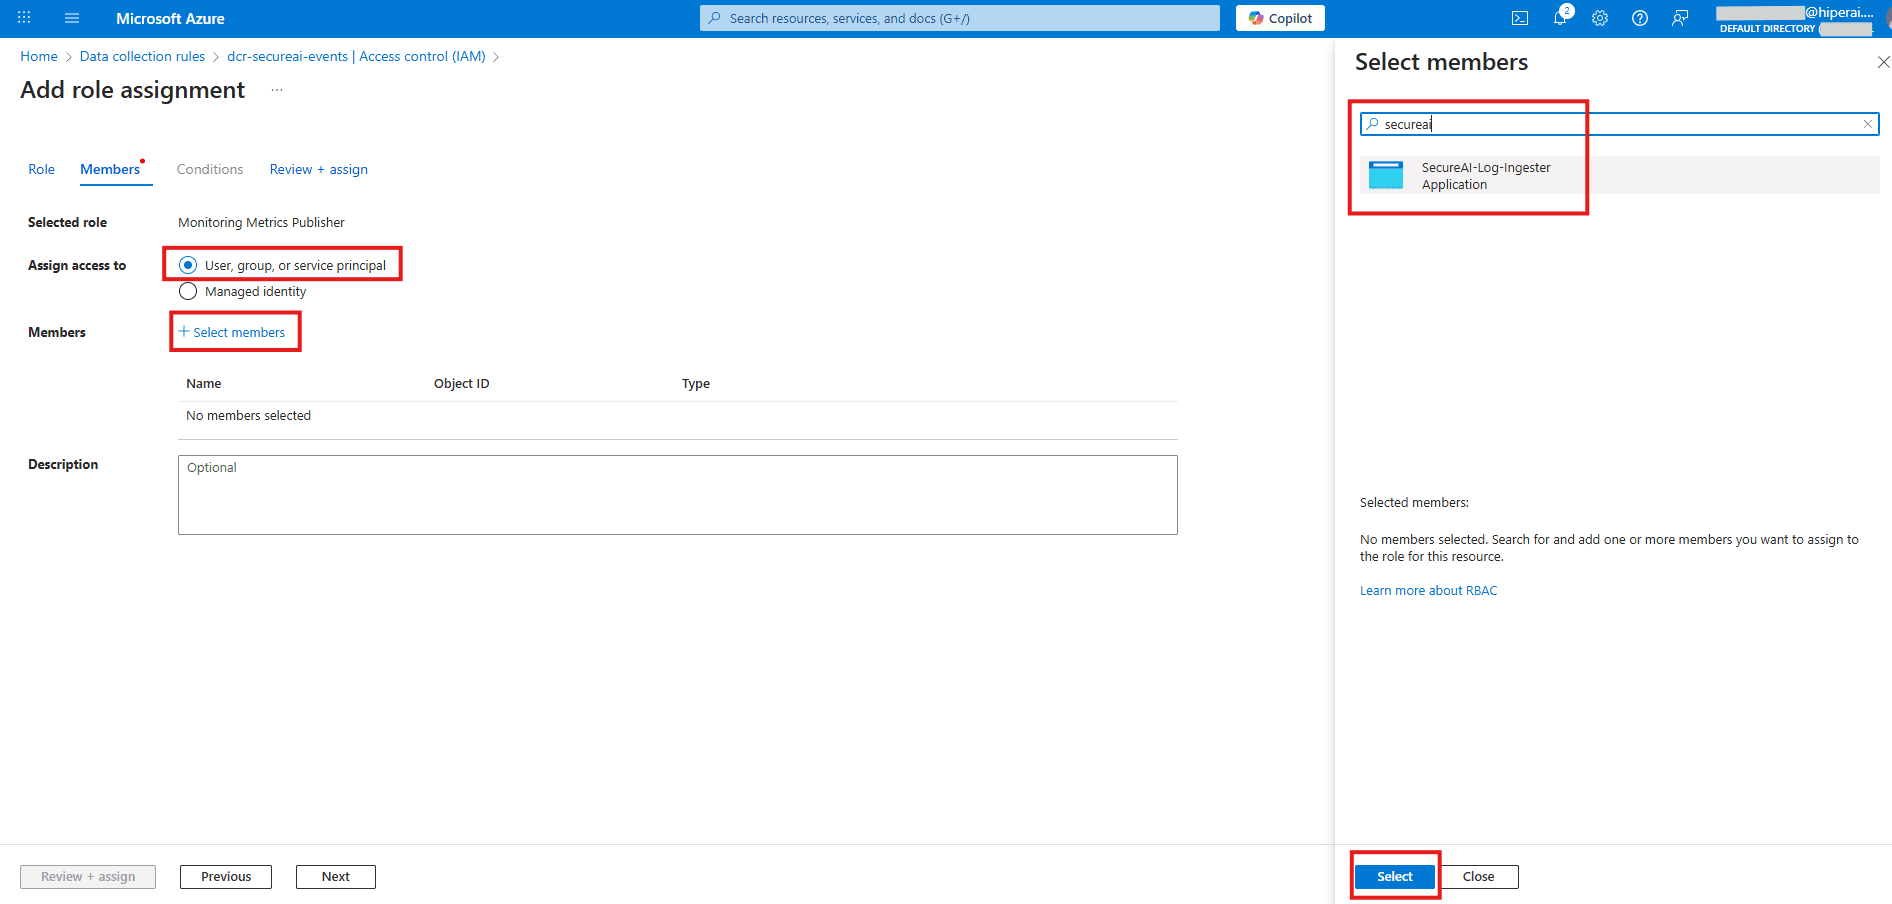
En el menú de la izquierda, vaya a Control de acceso (IAM) y haga clic en + Agregar → Agregar asignación de roles.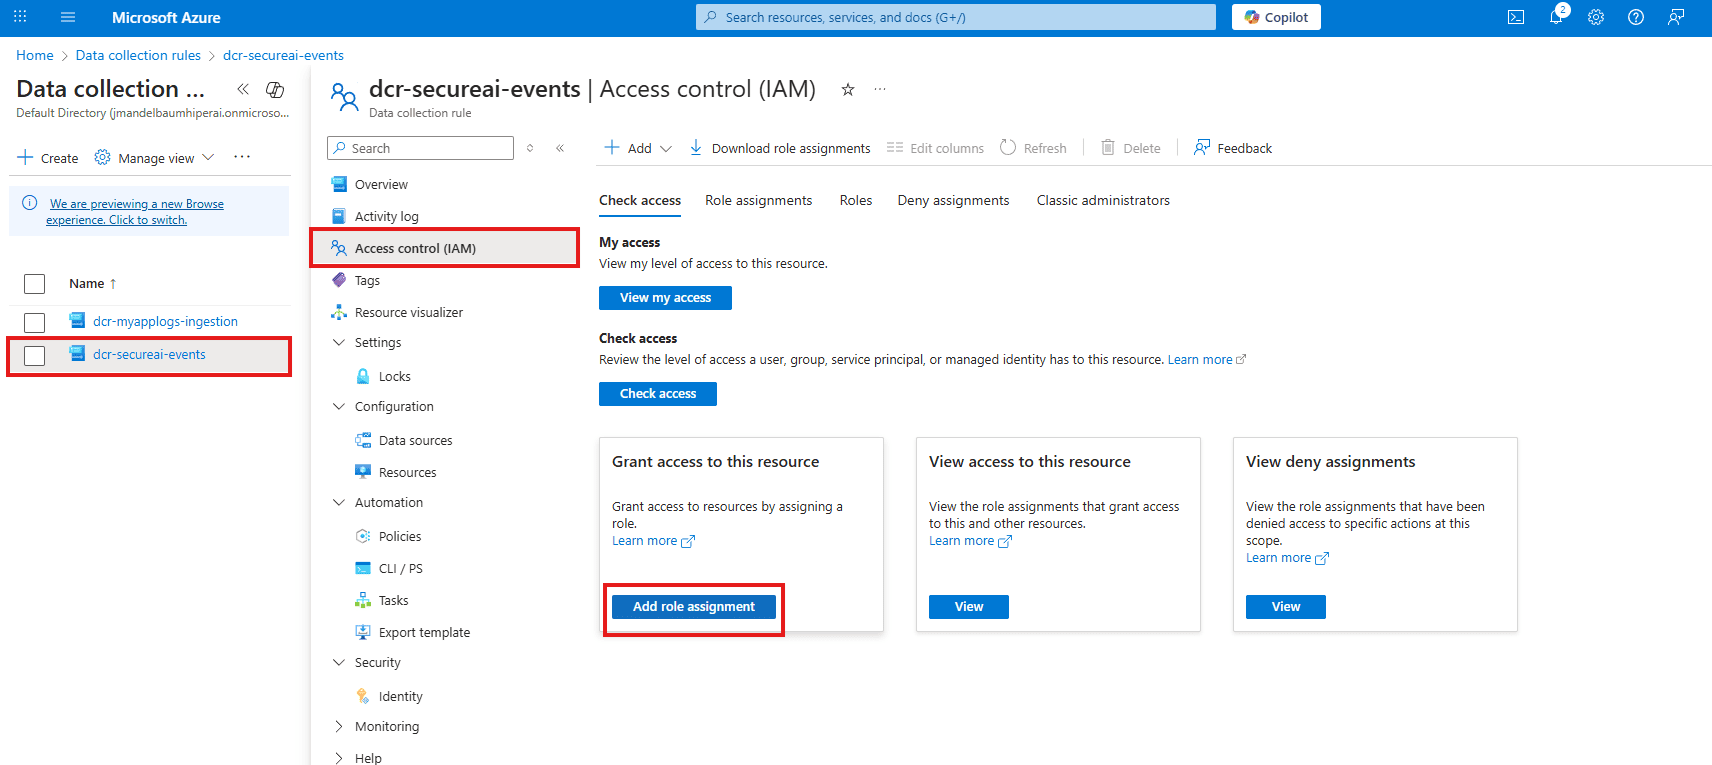
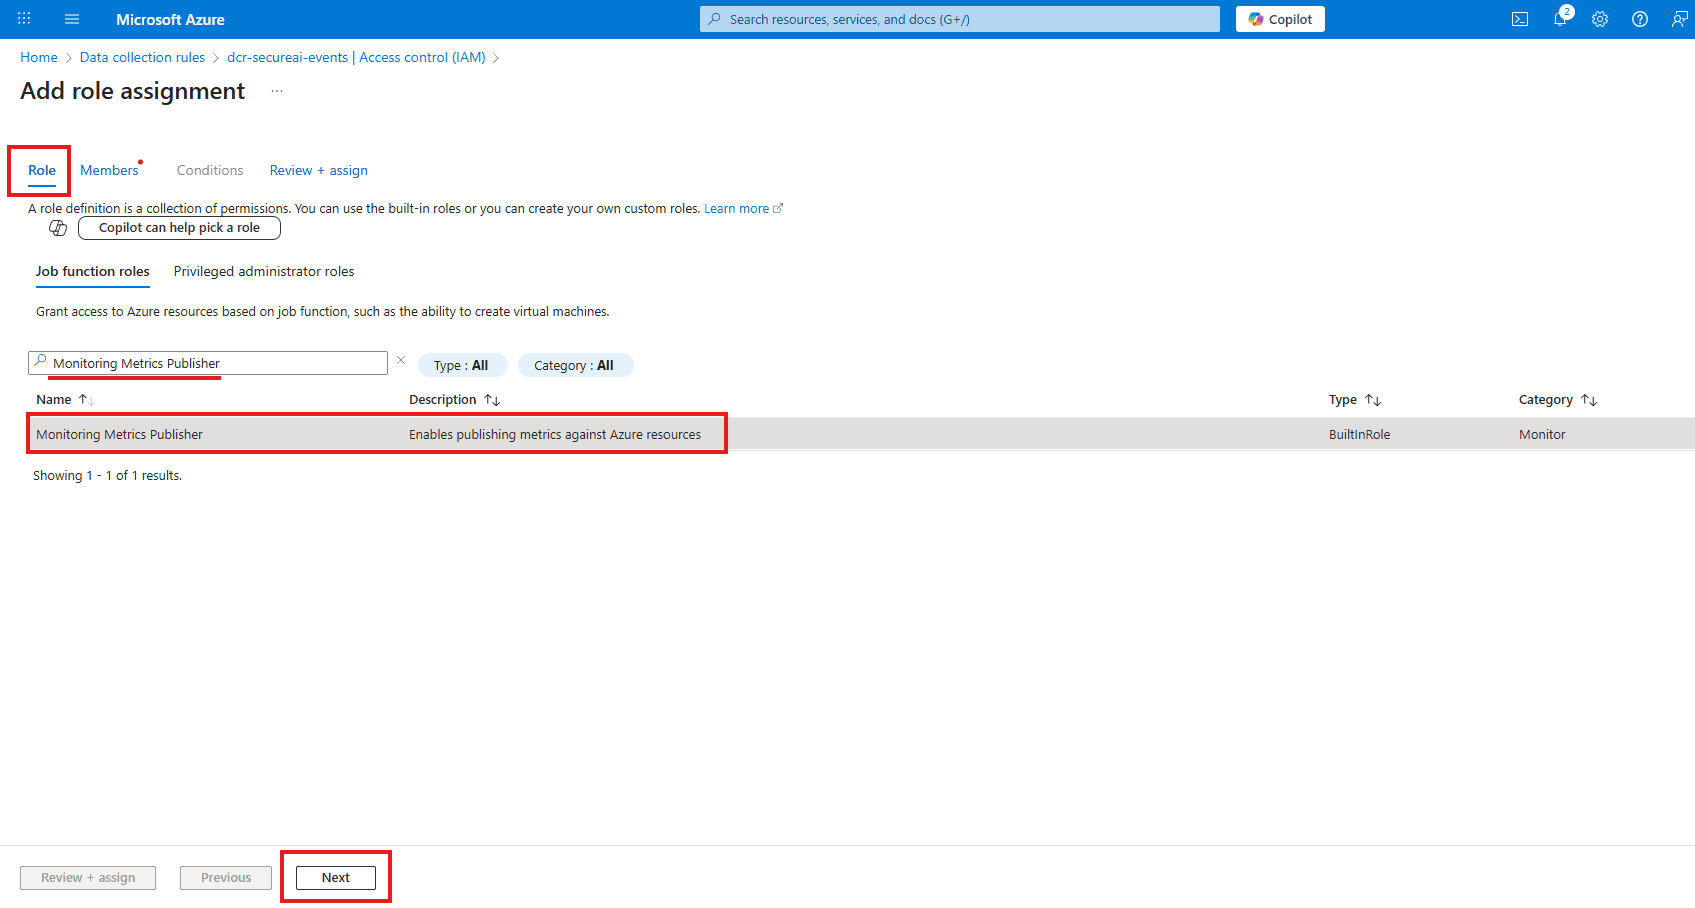
SecureAI-Log-Ingester). Selecciónelo.
Paso 4: Finalizar y compartir información
Ya casi has terminado. Sólo un último paso.A. Reúna la información
Para completar la integración, la aplicación necesita los siguientes seis datos:- ID de inquilino: (Desde el paso 1)
- ID de cliente: (Desde el paso 1)
- Secreto del cliente: (Del paso 1)
- DCE URI: (Del paso 2A)
- ID inmutable de DCR: (Navegue a su DCR
dcr-secureai-eventsy cópielo desde la vista JSON) - Nombre de la transmisión: este es un valor construido. El formato es
Custom-{TableName}. En nuestro caso será:Custom-secureaitosiem_CL
B. Configurar la aplicación
Ingrese estos 6 valores en los ajustes de configuración de su aplicación.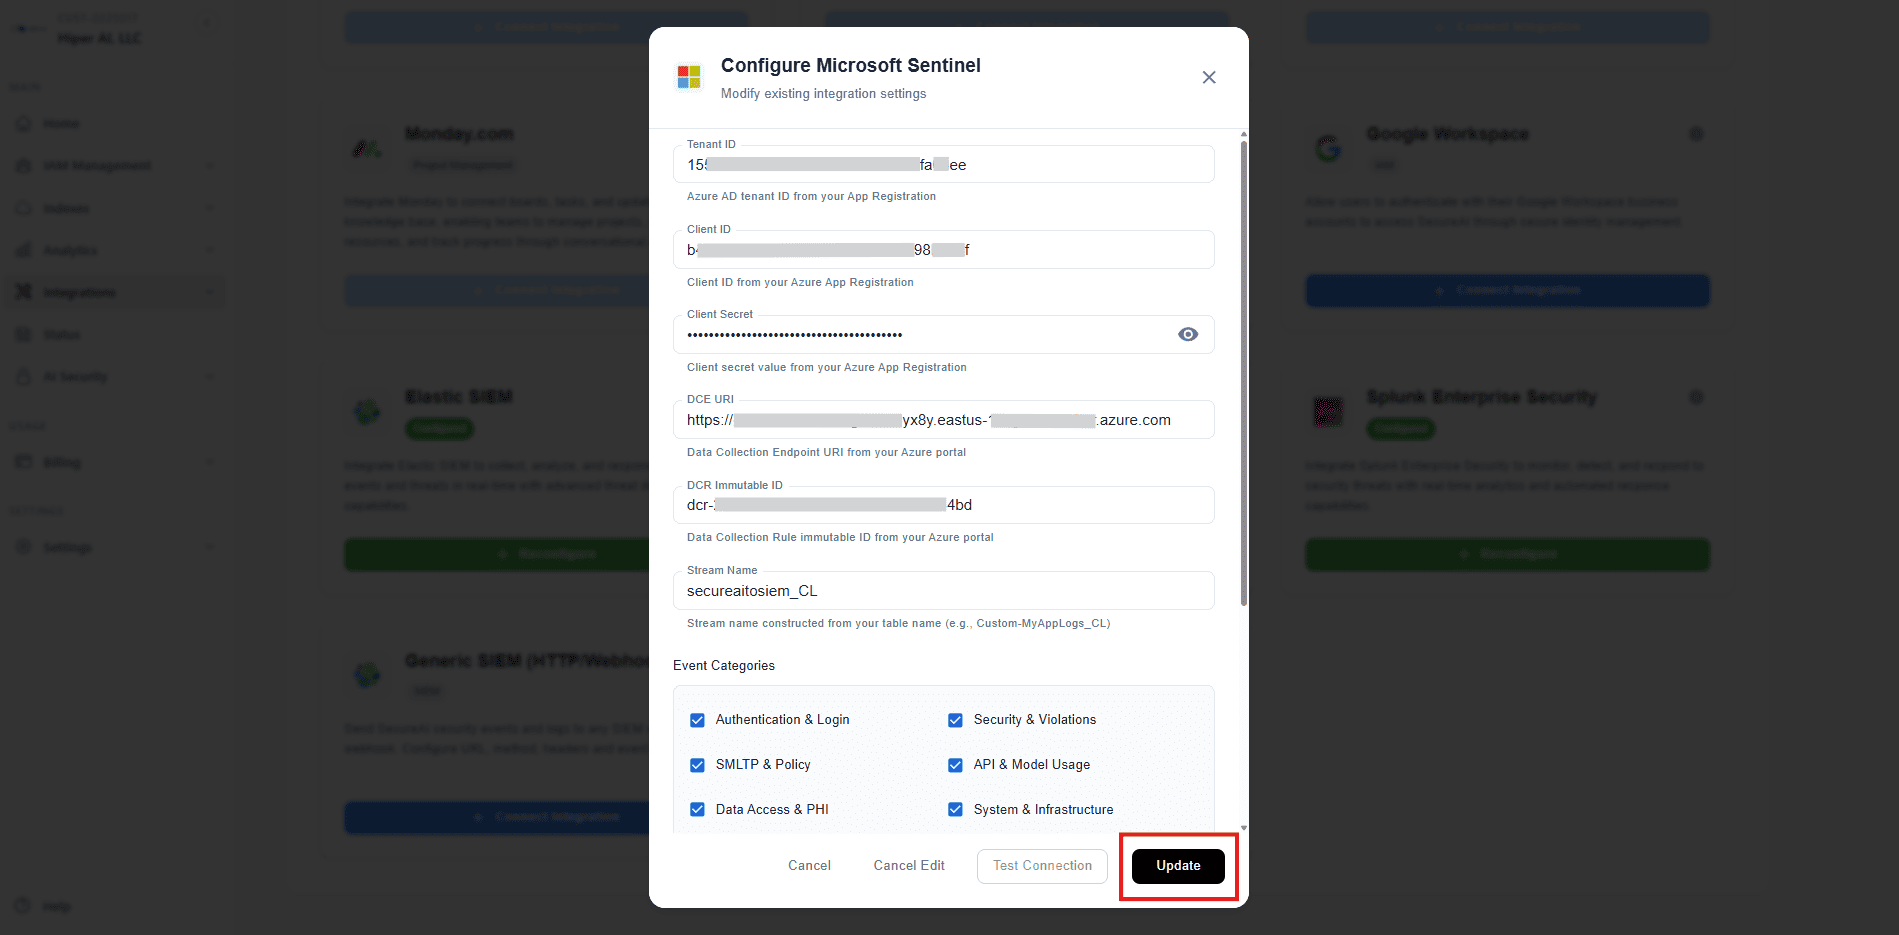
Paso 5: Verificar la integración
Una vez que haya ingresado los detalles de integración en la aplicación SecureAI, podrá verificar que la conexión esté funcionando correctamente.A. Pruebe la conexión
Utilice el botón “Probar conexión” dentro de nuestra aplicación. Esto enviará un evento de prueba a su espacio de trabajo de Microsoft Sentinel.B. Busque el evento de prueba en Log Analytics
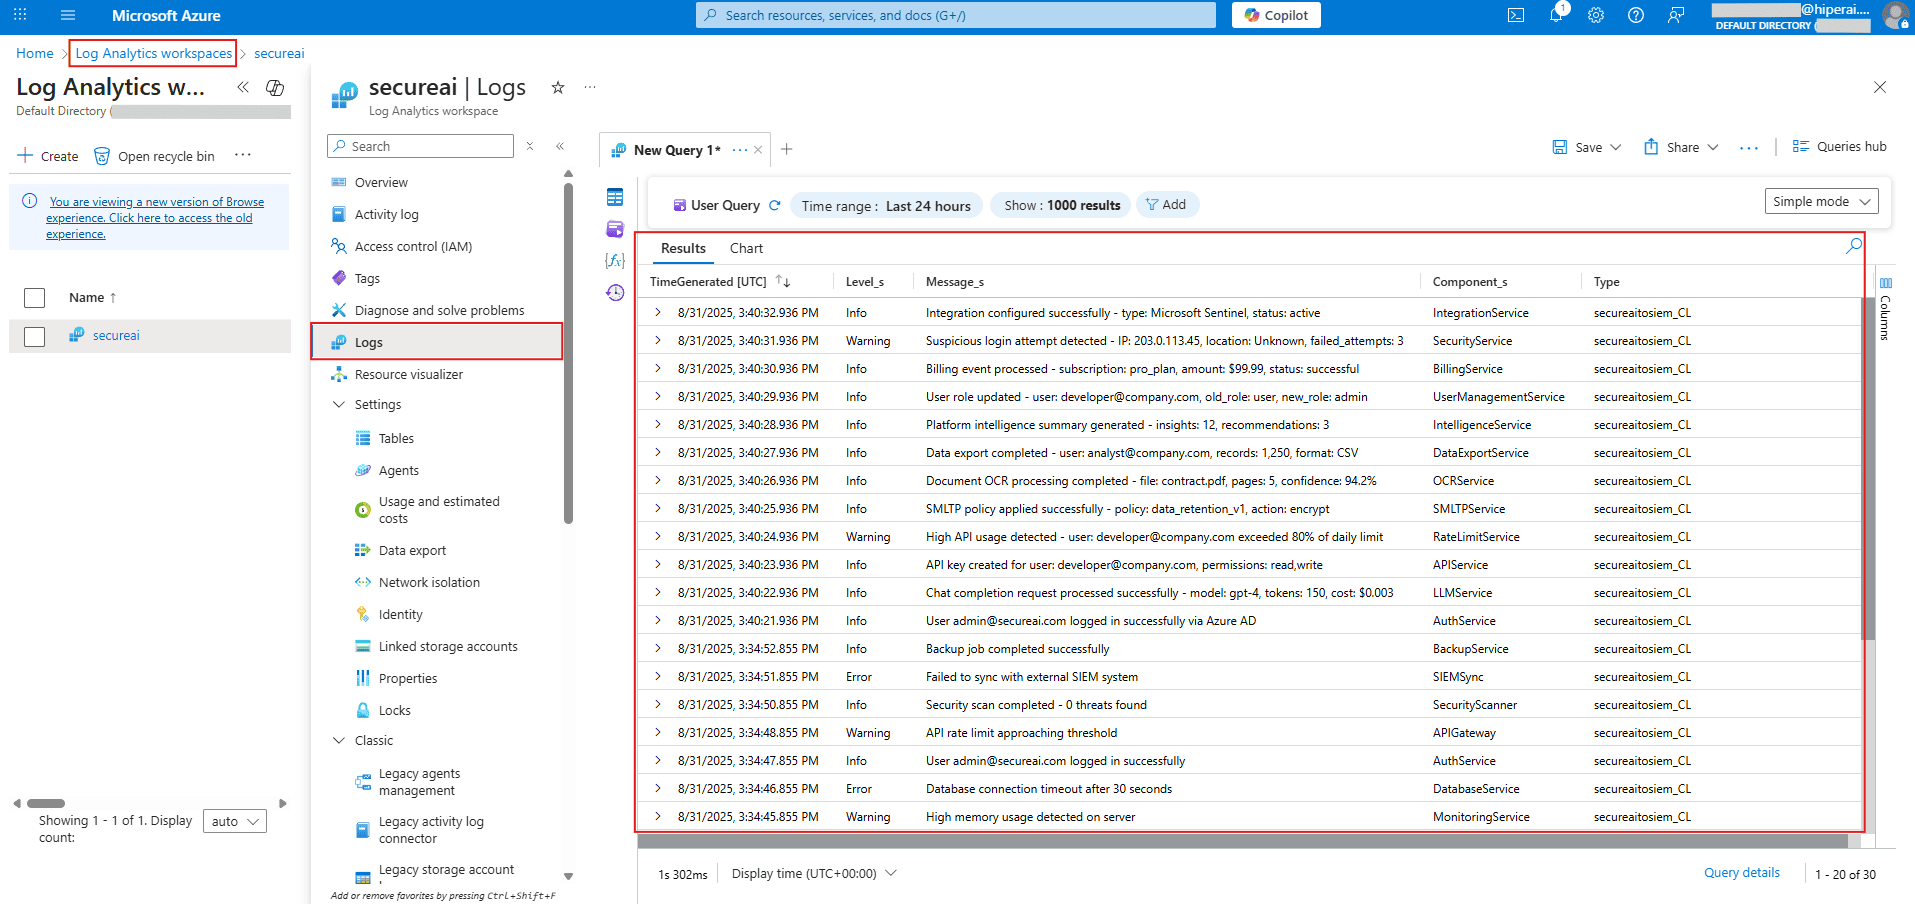
Para ver si el evento llegó a Microsoft Sentinel, vaya a su área de trabajo de Log Analytics y haga clic en Registros. Ejecute la siguiente consulta para ver sus datos entrantes:TimeGenerated, Level_s, Message_s, etc.) correctamente completadas. Si es así, ¡tu integración es un éxito! ✅